Winners
JetBrains Rider
What is JetBrains Rider?
JetBrains Rider is a cross-platform .NET IDE based on the IntelliJ platform and ReSharper. This fast & powerful, cross-platform .NET IDE enables you to develop .NET, ASP.NET, .NET Core, Xamarin or Unity applications on Windows, Mac, Linux.

Follow these instructions to get your 2 month full access to JetBrains Rider:
- Head to the JetBrains Store page and enter the code: HackerEarth
- Enter your details, choose Rider in the dropdown and apply the coupon
- Download JetBrains Rider and get started!
JetBrains Rider For Unity
"Using Rider to write C# makes me happy. I have never seen code refactoring tools that actually work - always without exception. It's amazing when you can rely on it."
Joachim Ante, Unity CTO & Founder
Features
- Powerful cross-platform C# Editor
- Easy start with Unity
- Control Unity editor
- Coding hints
- Debug Unity with ease
- Run Unity tests
- Unity console logs
- Performance highlighting
- Find Usages inside Unity files
- Shader support
- Explore Unity docs
JetBrains Rider is a fast and powerful C# editor for Unity that runs on Windows, Mac, and Linux. With the unbeatable 2500+ smart code inspections and refactorings, Rider enhances your C# experience, letting you write error-proof code much faster.
Rider has Unity support built in, and the very first time you open a Unity solution it will automatically configure Unity to use Rider as the default editor for C# scripts and shader files. Once done, double-clicking a C# script or shader asset will open the solution in Rider.

Thanks to the integrated two-way communication, you can switch into and out of Play mode, and pause and step a single frame without ever leaving Rider! The toolbar includes game view buttons Play, Pause, and Step, which correspond to the same buttons in Unity Editor and control the same behavior as Unity Editor does. A small Unity icon in the status bar will indicate whether Unity Editor is connected, refreshing, or in Play mode. Any changes applied in Rider in Edit mode will be instantly delivered to Unity Editor.

Rider provides top-notch code analysis for C#, and that includes Unity-specific code inspections and quick-fixes for them.
For example, Rider will warn you against using inefficient string literal comparison with the tag property and will provide a quick-fix to rewrite this as a call to CompareTag.
Similarly, Rider will warn you if you try to use the new keyword to create a new instance of a class deriving from MonoBehaviour or ScriptableObject. Just press Alt+Enter to have Rider fix the problem for you.

Rider makes it very easy to debug your C# scripts as they run in the Unity editor. Everything is already configured, and you just need to hit the Debug toolbar button, menu item or keyboard shortcut to attach the debugger to the running Unity editor. You can set breakpoints in the editor, step through your code, look at locals and watch values, and evaluate expressions.
With Rider, you can even debug the code that you don’t have debugging information for. Rider automatically decompiles external libraries on-the-fly, allowing you to debug the decompiled code, step into functions, set breakpoints, view and set locals and variables.

Rider allows you to run tests that interact with Unity’s API, and which can step through single frames, all from within Rider. And of course, you can explore the results of your Unity-specific tests, just like you would normal tests – you can filter by result, and click on stack traces to navigate your code.
The Unity Logs tool window with hyperlinked stack traces lets you explore the same events that are logged in the Unity editor console. It allows filtering by category (error, warning, or message), hides events based on when they were logged (in Play or Edit mode), and lets you easily navigate to any source file, class, method, or property mentioned in the log entry. Unity Logs cleans its output automatically after every switch to Play mode.

Rider helps you write better-performing Unity C# code. To do this, it highlights expensive Unity APIs inside methods that get called every frame, like Update and coroutines. Rider even highlights calls to methods that indirectly use expensive Unity APIs!
Besides that, Rider has many Unity-specific performance inspections and appropriate quick-fixes. It is aware of code patterns that are poor performance and can suggest automatic fixes for them, such as using a different API or overload, or caching values.

Find Usages now includes Unity scenes, assets, and prefabs. If you search for a class or method used as an event handler, Rider shows where it’s used in your Unity files, grouped by type, component name, and parent game objects. Even better, double-clicking the item highlights the usage directly in the Unity Editor.
Pulling this information from Unity files also means that Rider highlights event handler methods as being implicitly used. The implicit usage highlights are turned into Code Vision links, so you can see at a glance what classes, methods, and fields are implicitly used by Unity. And clicking the link will find those usages, even inside Unity files.

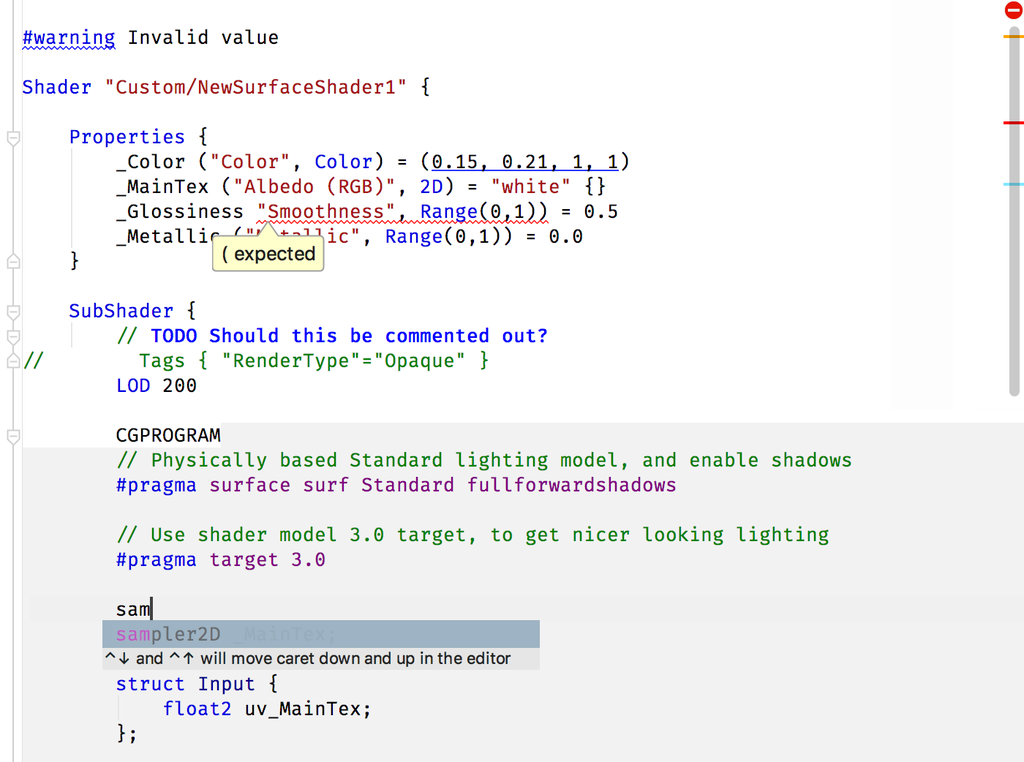
Rider also adds support for .shader files, with syntax highlighting, code folding, brace matching and more. Syntax errors in the ShaderLab sections are highlighted, todo comments are pulled into the To Do Explorer and color properties are highlighted, with a color picker for editing. Simple word completion is available throughout the file, including in Cg/HLSL blocks.

Rider displays external documentation for Unity symbols. You can either click the icon from the Quick Documentation pop-up (Ctrl+Shift+F1 if using the Visual Studio keymap) or use the View External Documentation action (Shift+F1) directly, to navigate to locally installed documentation, or to Unity’s hosted docs if they are not available locally.

Click here to know more about Jetbrains Rider!


